New post - 'An intro to agile for new devs'
The core of my skillset is front end, including expertise in React, page load performance, accessibility and authoring UI component libraries. I also have 8 years’ solid experience of Node.js.
I understand every angle of a successful agile team including user-centred research and design, continuous delivery, TDD, test automation & strategy, pairing and shared ownership of quality and dev-ops.
React
scalable CSS including CSS-in-JS
Node.js
Javascript
Typescript
page performance
accessibility
micro-services
micro-frontends
progressive enhancement
TDD & unit tests
BDD & end-to-end tests
responsive / mobile web
CI / CD
agile
rapid prototyping
Improving page load speed at TES with WebPagetest and SpeedCurve

This post originally appeared on the TES Engineering Blog.
We were given some dedicated time at TES to work on page load performance.
This post is about what we chose to measure and the tools we used (WebPagetest and SpeedCurve).
How are we defining 'page load speed'?
How quickly the user can see and interact with core page content after they navigate.
Non-core content could be adverts, their user avatar, or recommended links. It's important they appear as quickly as possible but they're not the main reason the user navigated to the page.
Where are the biggest gains to be made?
Steve Souders defined a rough split between back end and front end performance:
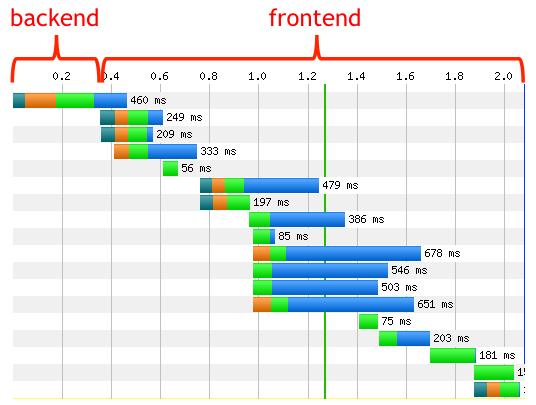
Each request has various stages:

The “backend” time is the time it takes the server to get the first byte back to the client.
The “frontend” time is everything else.
He surveyed page loads times for thousands of websites and found the majority of page load time was 'front end' (this was in 2012):
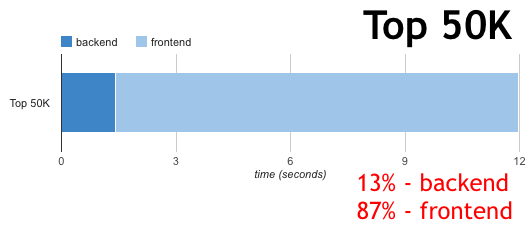
The biggest gains are to be made by focussing on front end performance.
Also, at TES, our front end architecture is reasonably consistent (we use the same base styles and webfonts across almost all pages, and some of the same Javascript). So we can make improvements to more pages quickly by focussing on the front end first.
Which tools can we use to measure?
WebPagetest
WebPagetest is a free web-based service that does 'synthetic' metrics - ie it simulates different network conditions like speed and latency (as opposed to capturing metrics from your actual users in the field - 'Real User Metrics aka RUM).
You can enter the URL of your page and it will give you a full analysis of the page load speed including HTTP waterfall graph, filmstrip and video.
SpeedCurve
SpeedCurve is a paid product that runs on top of WebPagetest that lets you run page speed tests as often as you like and graphs the results to show trends.
They've also just added a RUM product called LUX.
How do we measure page load speed?
1. Visual rendering speed
SpeedIndex is calculated as a number (lower === better) by WebPagetest. SpeedCurve shows it as an elapsed time.
Unfortunately, SpeedIndex doesn't seem to be an accurate indicator of when the core content becomes visible.
Because it's based on the proportion of pixels that have painted and it doesn't necessarily wait for the text to be rendered to load, we were getting SpeedIndex times lower than the point when the text became visible. The SpeedIndex for the test below was 5.87s but the text wasn't actually visible until 6.1s; (filmstrip).

We've now improved this, as we're inlining the main font in the CSS (using this technique, so there's no lag between the main page render and the webfont downloading:

I'm still treating SpeedIndex with a bit of caution as it sometimes seems to give a different timing to when the page is visually rendered according to the filmstrips.
Now that, in most cases, the text renders at the same time as the main styles, due to the inlined font, Start render seems more accurate.
The bulletproof (although manual) method to check visual render time is to use the waterfall for each test in SpeedCurve, or the filmstrip in WebPagetest. In SpeedCurve if you move your mouse horizontally across the waterfall a filmstrip will appear below it and you can get an accurate indication of when visual render occurred.
The 'Visually complete' metric isn't really useful either as on a long page with lots of images for example a news article, it would have a very high value even though the core above-the-fold content might have loaded quickly, which is what really matters to the user.
2. Time to interactivity
After the visual render, there could be a short pause before the user can interact with it.
If the page is fully progressively enhanced, any links and forms will work immediately while waiting for the Javascript to load. In this case, time to interactivity could roughly equal Start render, although we haven't tested this yet.
If the page isn't progressively enhanced, the user has no option but to wait until the Javascript loads and bootstraps.
If the app is client-side only, the experience is even worse - the user won't even see anything until the Javascript is downloaded and executes. This could make the wait seconds longer on mobile.
In both cases where the user has to wait for Javascript to run before they can interact, we can try and take a rough timing of when that point occurs. The timing is when they can interact with the core app, not ancillary functions like login / avatar.
This is achieved by calling:
window.performance.mark('app-interactive')
This uses the User timing API to add an entry to the window.performance marks array. You can view any that have been added with:
window.performance.getEntriesByType('mark');

Call it from the point in your application Javascript when UI event handlers have been hooked up (for a React app this might be the root component's componentDidMount handler).
WebPagetest (and then SpeedCurve) picks up all window.performance marks automatically. SpeedCurve even shows them on its waterfall graphs, and we can track these metrics on the SpeedCurve dashboard and favourites.
A video of me talking about the performance issues discussed in this post.